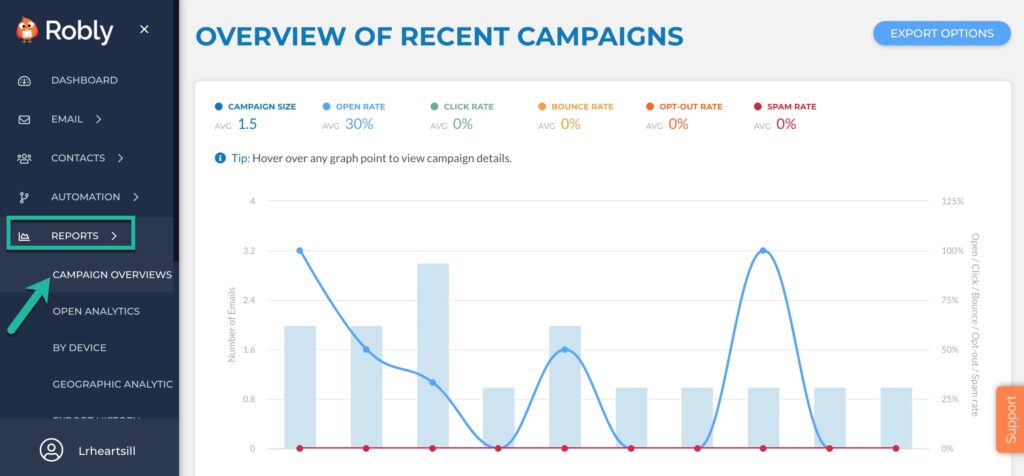
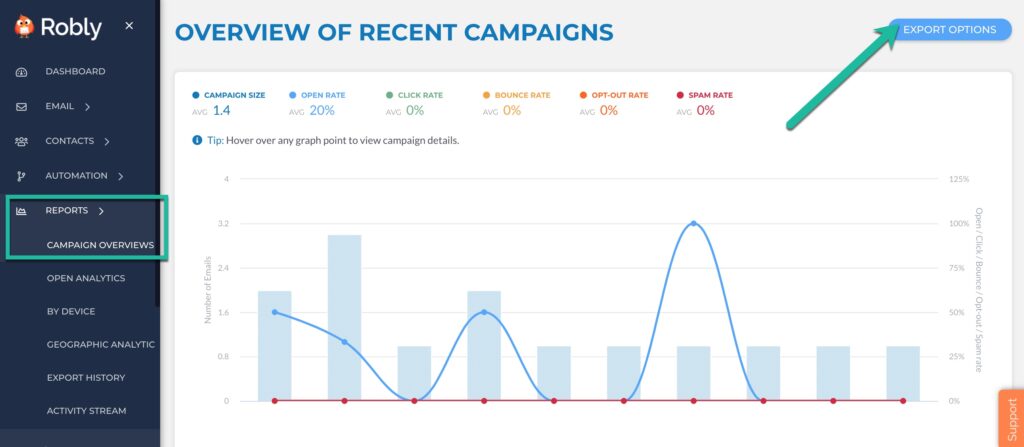
Click Reports > Campaign Overviews to see real-time analytics of your campaign.
Non-Campaign Specific Reporting
On the Reports dashboard, you can see a graph with your historical campaigns. You can see the number of sends for each campaign, open rate, click-through rate, bounce rate, opt-out rate, and spam rate.
On the left-hand navigation under Reports, you have options for topline information:
-
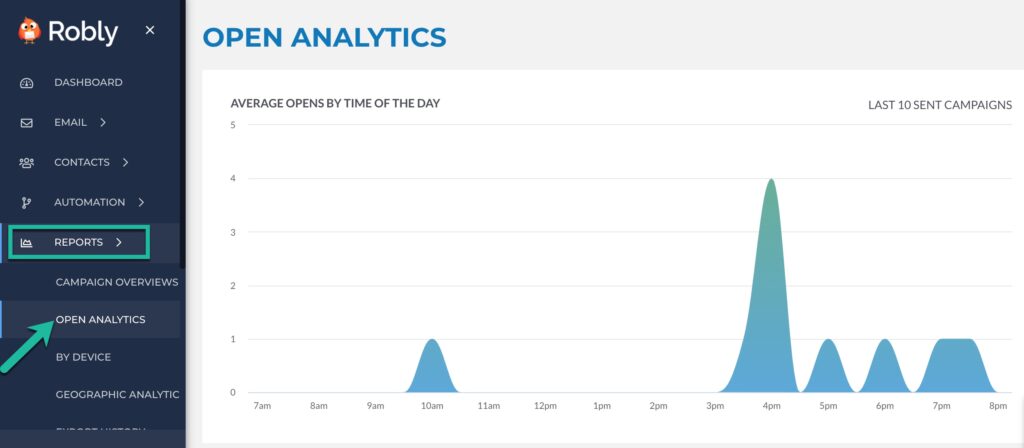
Open Analytics
This graph looks at your opens over the last sent campaigns. Click and drag your mouse simultaneously forward or backward to look at a more specific time frame. Reset zoom resets the page.
-
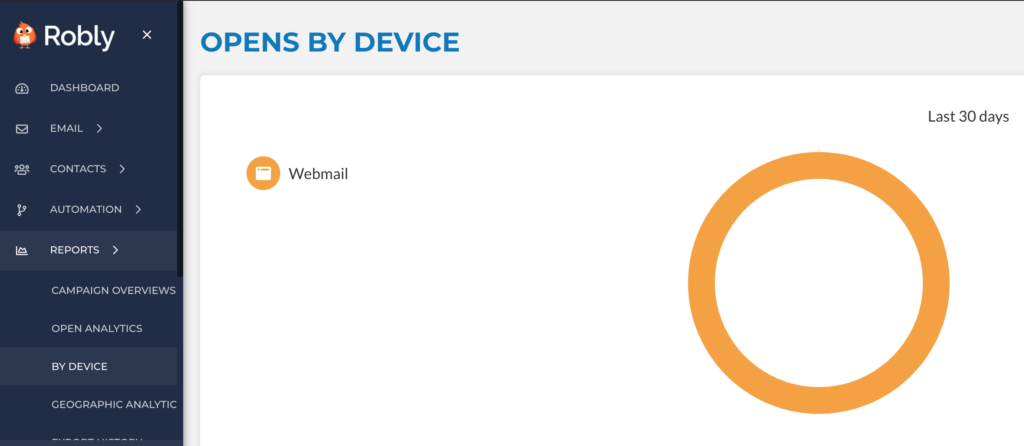
By Device
This chart breaks down ALL opens over the past 30 days by device.
-
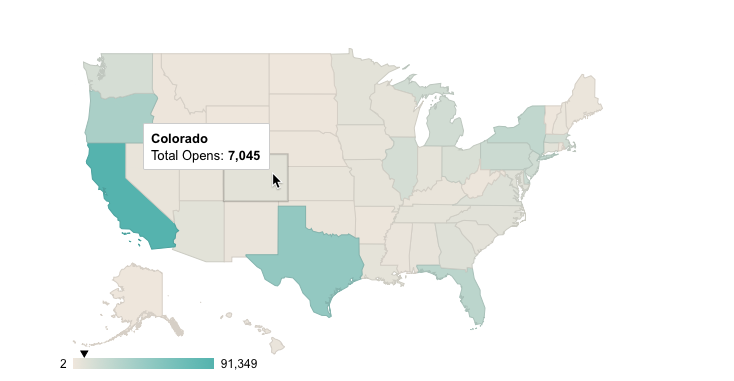
Geographic Analytics
Geographic analytics, based on IP address, for all openers. Displays the current month’s data and resets on the first of each month. Toggle between the U.S. Map and World Map options.
-
Export History
Any data exported from the Reports section of the site can be found here as a downloadable .CSV file.
-
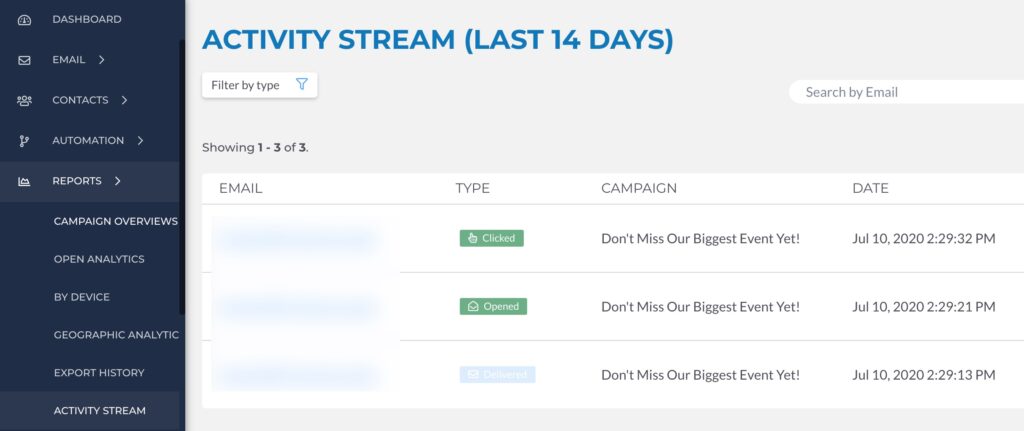
Activity Stream:
This is a realtime feed of your sent test emails and campaigns. It will show you, from most to least recent, opens, clicks, deliveries, bounces, deferrals, and blocks. This is the best place to start if someone tells you they didn’t get your email. You can use the search field to find a specific email address and whether or not that email was successfully delivered.
-
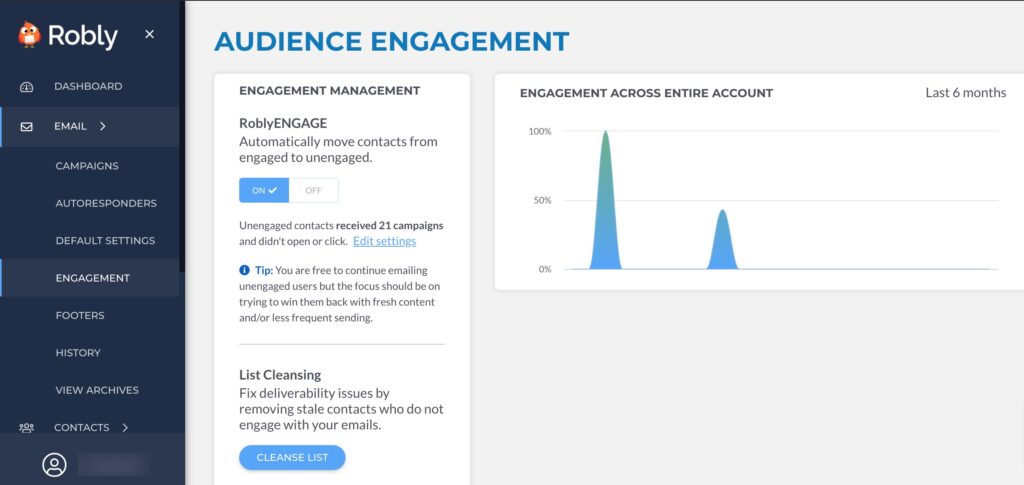
Engagement
This section allows you to isolate and remove unengaged users. For more information on this tool, click here.
-
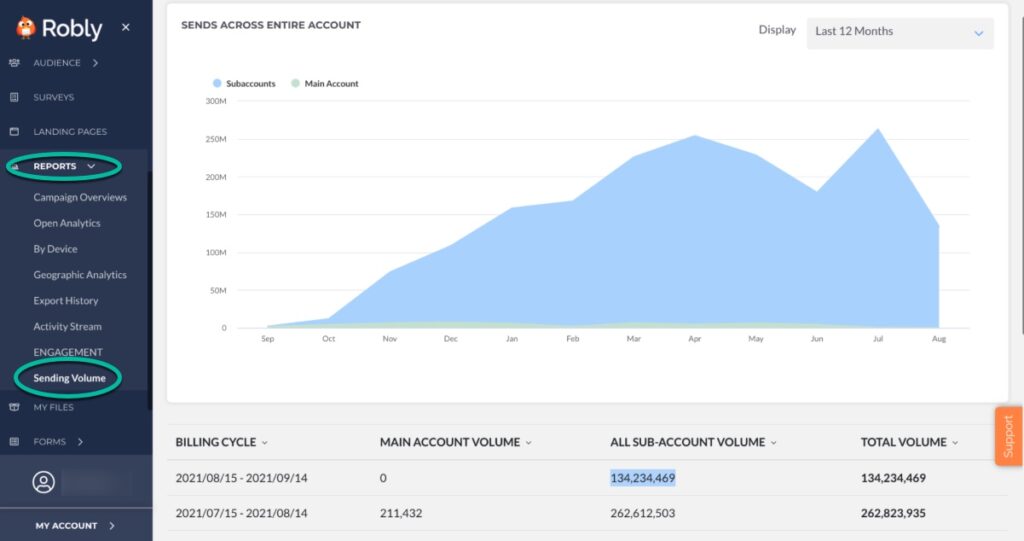
Sending Volume
For high-volume senders on a CPM plan, you can access Reports > Sending Volume to see an overview of your sending volume.
Campaign-Specific Reporting
In the campaign list on the Reports page, you can drill down into any campaign by clicking on the name. You can see the total number of emails sent, emails delivered, total opens, unique opens, click rate, hard and soft bounces, opt-outs and abuse complaints.
Campaign Report
Clicking on a campaign name will bring you to the Campaign Report. From there, you can look at the campaign’s Overview, Delivery, Domain, Activity, Campaign Details and Recipients.
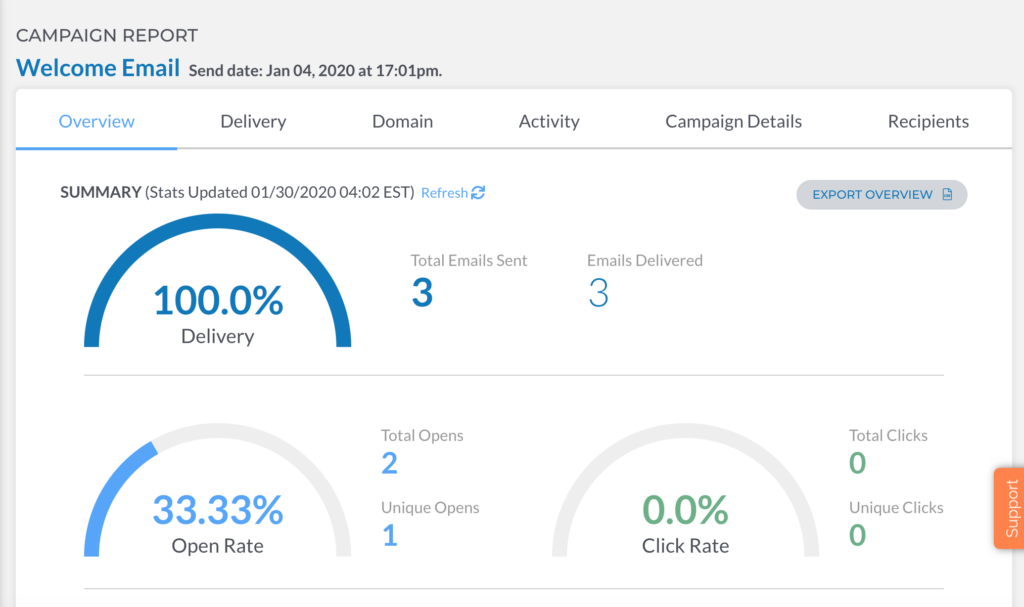
Overview
Here’s the information you can see from here. Keep in mind that this data updates and changes as users open and engage with your emails:
Emails Sent: How many emails were sent.
Emails delivered: This number and percentage indicates that we have received a response from the recipients server indicating that the email was successfully delivered. If the number isn’t at 100%, it means we haven’t yet received a response from the recipient’s server or have not yet delivered the email. Note: If you send a campaign using Robly AI and the send window has not fully passed, you will see a lower delivery percentage compared to how many were sent. With Robly AI, 100% of the emails get sent; however, they are slowly delivered throughout your chosen delivery window.
Hard Bounced: How many emails bounced – this only refers to hard bounces, which we will automatically remove from your list. If you click into your bounce list for a specific campaign, you will see both hard and soft bounces, as well as:
Drops: A drop occurs when our systems identify that a message is sent to an email address that is already listed on one of the suppression lists: Bounces, Unsubscribes, Spam reports and Invalid Emails. If an email is already on one of the lists mentioned above, our systems automatically drop the email in order to protect your Sender Reputation.
Blocks: A block is a temporary rejection. This could be caused from something like the sending IP address being blacklisted or users reporting your IP as sending a lot of spam. In contrast, a bounce is more of a permanent rejection (such as the email address not existing). If you see a high number of blocks in your campaign, contact us at support[at]robly.com.
Deferred. A deferral happens when a receiving server refuses a message, but with a specific explanation that tells our server it’s only a temporary refusal. They usually say things like “user is receiving mail at too great a rate right now, please try again later”, or “user’s mailbox is over quota.” We continue to attempt to send messages for up to 72 hours until the message is delivered.
Open Rate: This is your number of unique opens. One person may open your email 4 times, but that counts as only 1 unique open. An email’s open rate is the percentage of recipients who opened your email compared to how many contacts were sent the email. The Open Rate percentage is calculated by dividing the number of unique opens by the number of emails sent excluding the number of bounces.
Click-Through Rate: A click-through is when someone clicks on a URL in your campaign. This rate is the percentage of click-throughs based on the number of contacts who opened the email. The click-through distribution total is merely the total of all clicks for that campaign – which is always 100%. These rates vary depending on industry, content, list quality, and more. Click here to see some industry-specific averages.
Total Opens: The number of times your email was opened. An email registers as opened when an invisible pixel, which is an invisible image, basically, is downloaded by the email client. Bear in mind that oftentimes what gets measured as an open isn’t actually an open: it’s just an email client downloading the image pixel to a preview pane, or vice versa – a person with images blocked may read your email.
Soft Bounces. A soft bounce is a temporary delivery delay or issue. Reasons for a soft bounce could be that a user’s inbox is too full or the server is experiencing delays or is temporarily unavailable. If a contact soft bounces 6 times in a row, they are automatically removed from your list.
Spam Complaints: Someone has marked your campaign as SPAM. Don’t fret: people oftentimes forget they opted-in to your list, or accidentally mark it. If you have too many SPAM complains for one campaign send, though, your account may get locked and we’ll have to talk to you about your list. We automatically remove SPAM complaining email addresses from your list.
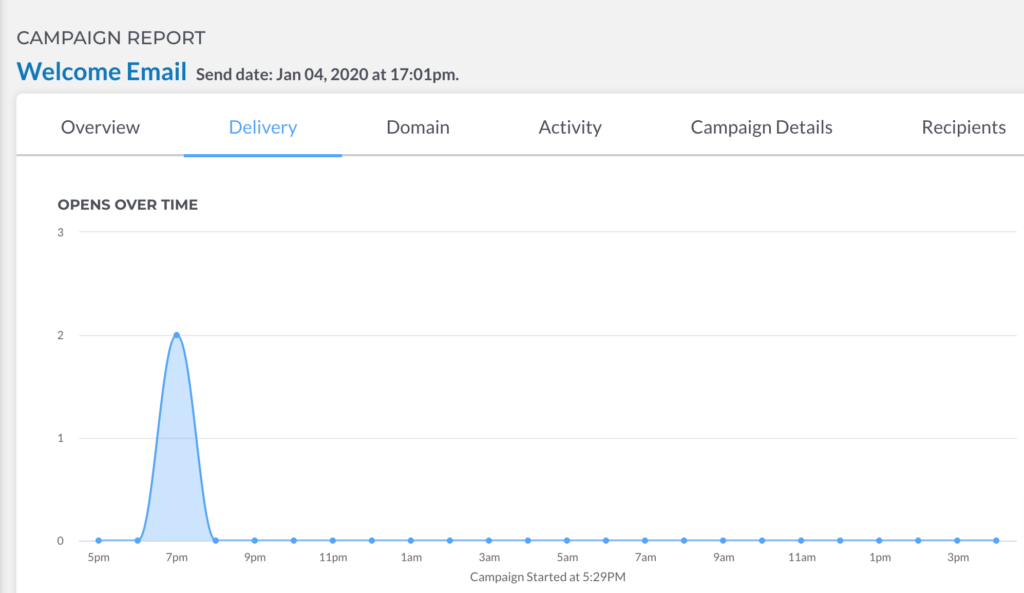
Delivery
The delivery section breaks down opens over time. You can use your cursor to drag and dive into more specific times:
Domain
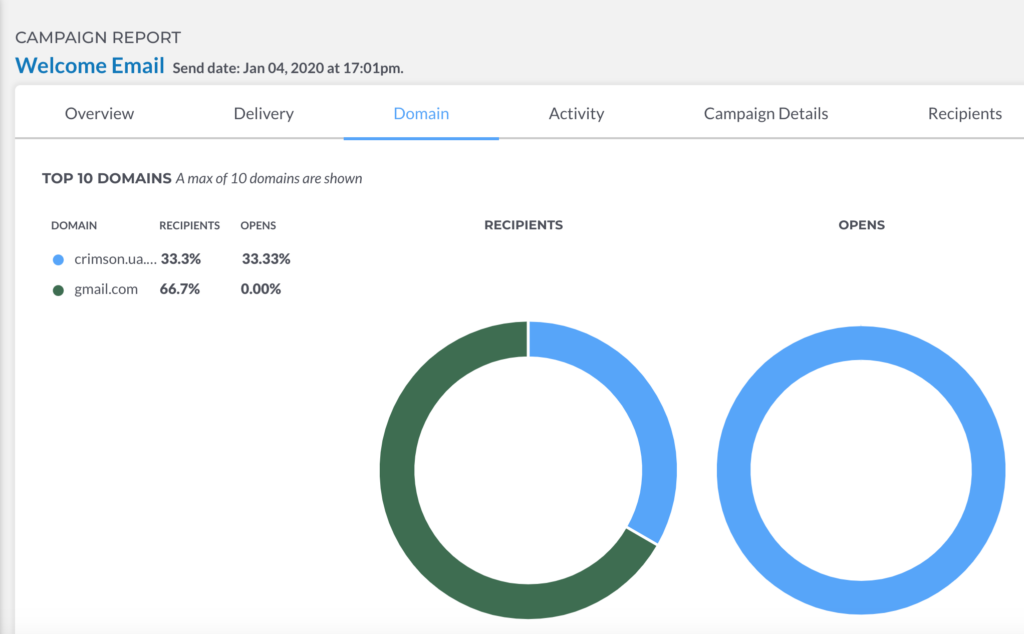
This section shows you what percentage of your list is made up of a specific domain, as well as your opens per domain.
The top half shows you recipients by domain and opens by domain:
While the bottom half shows you open rate by domain:
Activity
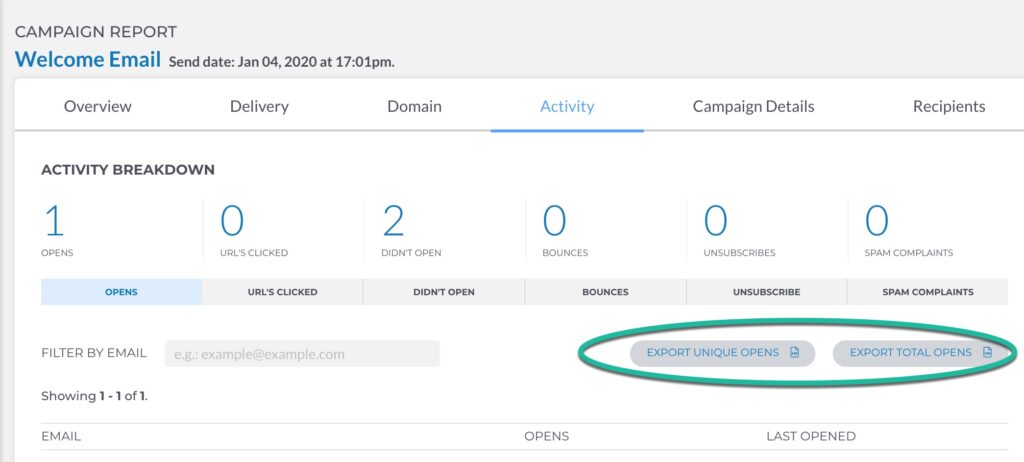
Clicking into any of these sections under Activity shows you a list of recipients who opened, clicked, didn’t open, bounced, unsubscribed, and filed spam complaints.
Campaign Details
This section shows details of your send: time, date, lists that were sent to, from and reply-to emails, whether or not it was pushed to social media, and more: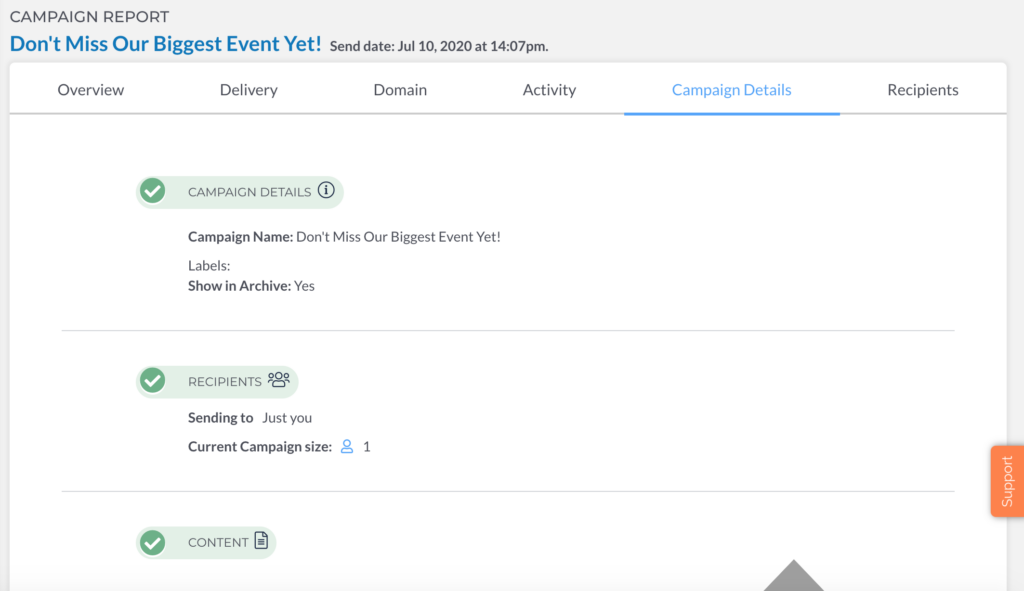
Recipients
Recipients is a list of all emails that were included on the campaign send. You can export these files straight from each page; more info on exporting below.
Exporting Data
After clicking into a specific category under Activity, you can export data for each category as Excel CSV files.
Any exported files will be emailed to the notification email address you have for exports under My Account > Notifications but can also be downloaded directly from your Export History tab:
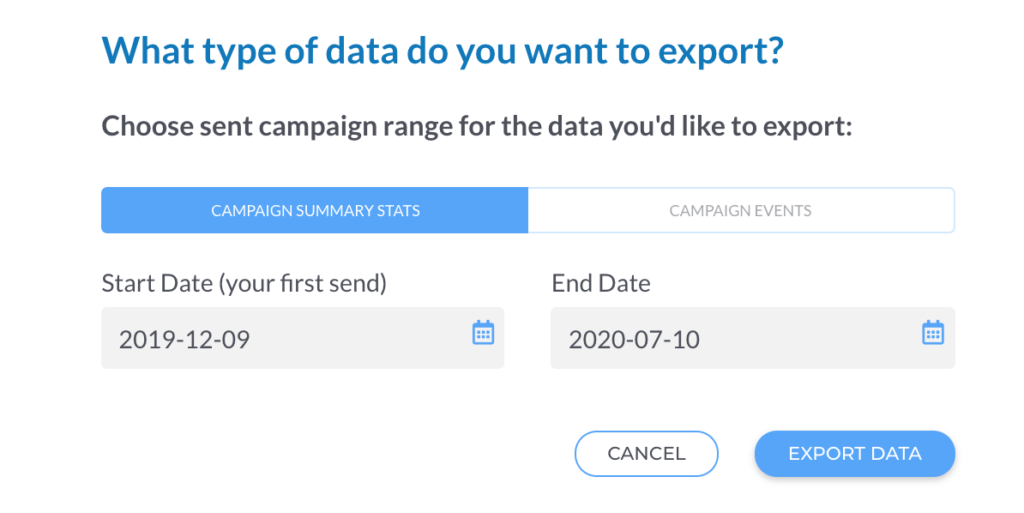
You can also export custom data by clicking Reports > Campaign Overviews > Export Options and use the date ranges of your choosing.
From here, you can choose Campaign Summary Stats or Campaign Events, and choose your date range:
As we mentioned above, exported files will be emailed to the notification email address you have for exports under My Account > Notifications but can also be downloaded directly from your Export History tab.
